Key takeaways

  • When coupon payments on shorter-term Treasury bonds exceed the interest paid on longer term bonds, the result is an inverted yield curve.

  • The yield curve first inverted in 2022 and the trend persists in 2023.

  • While far from a certainty, some market observers consider a yield curve inversion a harbinger of economic recession.

Investors continue to face unusual dynamics in the bond market today that date back to early 2022. Chief among which is the emergence of an “inverted yield curve.” This is a somewhat rare occurrence, when interest paid on shorter term U.S. government-issued bonds exceeds the interest rates on longer term bonds. While it may sound like an arcane event, history suggests that an inversion of the yield curve is a warning signal for the U.S. economy, potentially the precursor of a recession. How should investors react and what does it mean for the economy in today’s environment?


What is an inverted yield curve?

The concept of the yield curve starts with bonds of different maturities and is often based on yields of U.S. Treasury securities. These are bonds of equal credit quality (all backed by the full faith and credit of the U.S. government) but with different maturities.

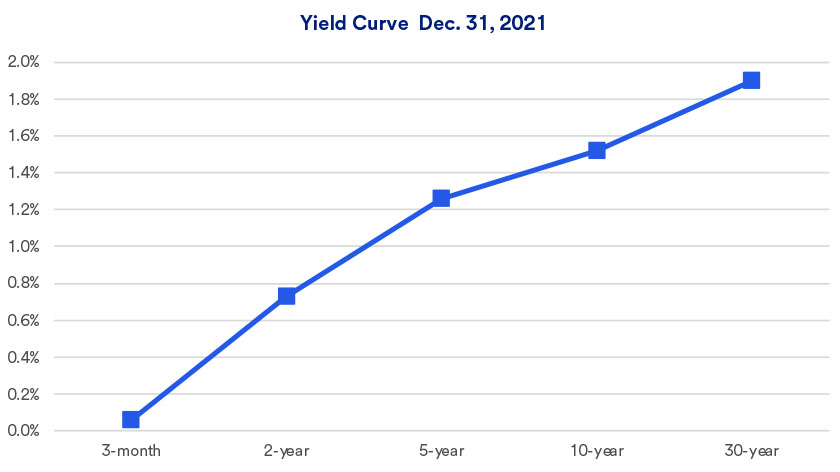
A simple way to view the yield curve is to look at current interest rates, or yields, paid by U.S. Treasury securities with maturities of three months, two years, five years, 10 years and 30 years. Investors typically expect to be rewarded with higher yields when they invest their money for longer periods of time. This is referred to as a normal yield curve, one where yields rise along the curve as bond maturities lengthen. The chart below depicts a normal, upward sloping yield curve among these five U.S. Treasury securities, depicting actual yields in the Treasury market at the end of 2021.1 At that time, the yield on 3-month Treasury bills stood at 0.05%, and moved progressively higher as maturities extended along the yield curve.

chart depicts a normal, upward sloping yield curve among five U.S. Treasury securities, depicting actual yields in the Treasury market at the end of 2021.

Source: U.S. Department of the Treasury

However, there are unusual circumstances where the yield curve “inverts.” The use of this term does not necessarily indicate that the slope moves from higher to lower when reading the chart from left to right. But it can mean that yields on some shorter-term securities are higher than those for longer-term securities.

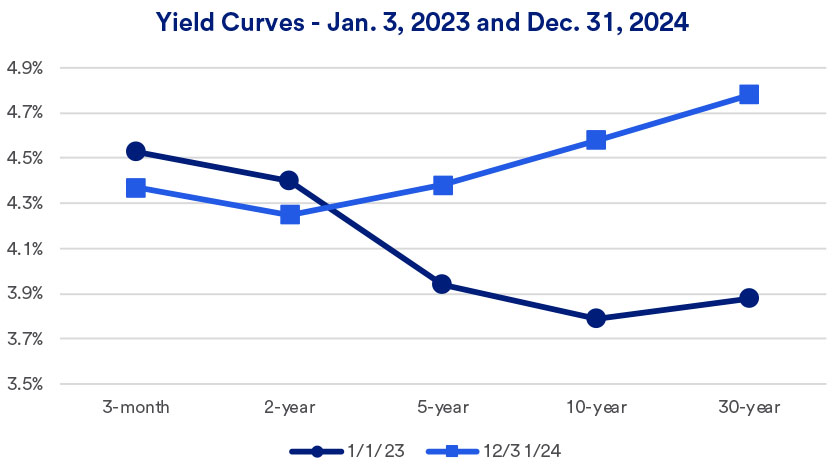
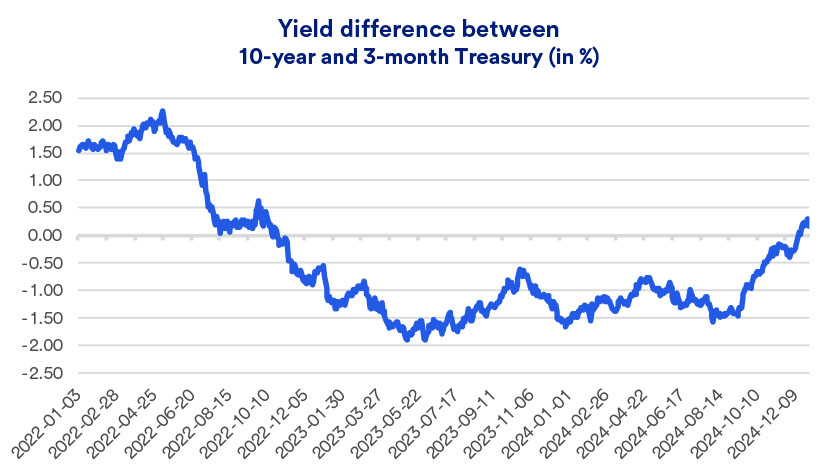
In 2022, the yield curve first inverted on April 1 when comparing two of the key indicator rates along the curve – the 2-year Treasury note and 10-year Treasury note.1 After a short period of time, yields reverted to a normal curve, but an inversion between the 2-year and 10-year Treasuries occurred again in early July 2022. Just a few months later, in late October, the yield on the very short-term 3-month Treasury bill moved above that of the 10-year Treasury note. The inversion became more pronounced toward the end of 2022 and the spread widened in 2023. Interest rates paid by 3-month Treasury bills are now more than 1.75% higher than those available from 10-year Treasury bonds.

chart depicts an inverted, downward sloping yield curve among five U.S. Treasury securities, depicting actual yields in the Treasury market as of June 5, 2023.

Source: U.S. Department of the Treasury

As of June 5, 2023, the yield on the 3-month Treasury bill was 5.46% while the 2-year Treasury note closed at 4.46%. By comparison, the yield on the much longer-term 10-year U.S. Treasury note was 3.69%.

Some analysts see this rare event as a key economic signal, with many speculating that it foretells a future recession. Rob Haworth, senior investment strategy director at U.S. Bank, believes the inversion of yields between 3-month and 10-year Treasury securities is particularly notable. “It represents a higher cost for corporations,” says Haworth. “With short-term rates so high, companies are increasingly reluctant to borrow, as it makes it more challenging to realize a payoff when investing the borrowed capital in new equipment and facilities or added employees.” Haworth indicates that this can be a precursor to a slowdown in economic activity.


Signs of a recession?

How reliable of a recession indicator is the inversion of 3-month and 10-year Treasury yields? “It’s hard to know for certain, but historically, when we see such a significant inversion, it typically points to a recession,” says Matt Schoeppner, senior economist at U.S. Bank. “Banks tend to start pulling back from lending in this type of environment, and higher interest rates also dampen consumer borrowing.”

“While bank lending has tightened, it’s not clear that it’s happening at a pace that is indicative of a recession.”

Matt Schoeppner, senior economist at U.S. Bank

Schoeppner adds that while these factors are potential harbingers of an economic downturn, it’s not yet a foregone conclusion. “While bank lending has tightened, it’s not clear that it’s happening at a pace that is indicative of a recession,” says Schoeppner.

Haworth says that unusual factors leading to the current environment may alter expectations. “It’s important to remember that there was a significant amount of fiscal stimulus in the form of government payments to individuals and businesses that helped boost the economy,” he says, referring to government support programs during the early stages of the COVID-19 pandemic, which began in 2020. “Government support programs, along with monetary stimulus by the Fed created unusual circumstances leading into the current yield curve inversion cycle.” Haworth says given that the economy continues to grow, albeit at a slower pace, a recession may not be inevitable in the near term despite the bond market’s unusual dynamics.

He believes key signals about future economic strength will come down to whether labor market trends reverse, leading to rising unemployment. Recent data shows the unemployment rate at 3.7%, however, still lingering near a half-century low.2 To this point, the strength of the labor market has helped keep the economy on a growth trajectory.


The Federal Reserve’s interest rate influence

Beginning with the last recession, triggered by the onset of the global pandemic, the Fed reduced the short-term federal funds target rate to near zero percent, which helped keep rates on short-term government debt securities low. As the first chart above (from 2021) shows, yields on the shortest-term government securities were near 0%. At the same time, the Fed began making monthly purchases of Treasury bonds and mortgage-backed securities, a step that helped moderate interest rates on the long end of the yield curve.

Once inflation emerged as a persistent concern in 2021, the Fed shifted its strategy. It eventually ended its bond purchases in March 2022 and began to reduce its more than $8 trillion in asset holdings.

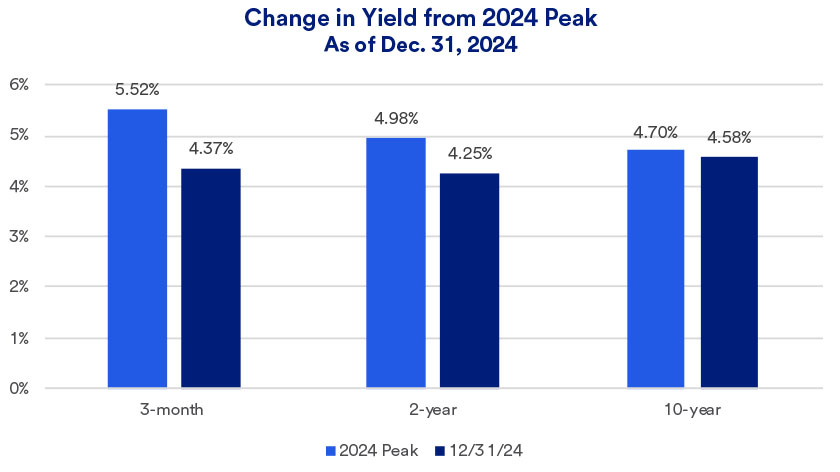
Short-term rates in the broader bond market tend to respond to Fed monetary policy related to the target federal funds rate it controls. The Fed raised the fed funds rate from near 0% prior to March 2022 to a range of between 5.00% and 5.25% by May 2023. Since the Fed shifted its strategy, yields on 3-month U.S. Treasury bills jumped, from 0.01% at the end of 2021 to nearly 5.5% today. The Fed may still be looking to raise rates further, and Fed officials continue to insist they will maintain elevated interest rates for an extended period in an until inflation comes down. Haworth believes that as the Fed sets monetary policy, it’s paying close attention to the impact on the bond market in the hopes of reestablishing a normal yield curve. He points out that the Fed has many tools available to try to influence yields at different maturities in order to effectively achieve its goals of cooling off inflation while avoiding a recession.


Where the economy goes from here

The outlook for the U.S. economy in 2023 has become a bit cloudier in recent months. After growing at a rate of 5.9% as measured by Gross Domestic Product (GDP) in 2021, the economy expanded by just 2.1% in 2022, then slowed to an annualized growth rate of 1.3% in the first quarter of 2023.3 It’s an indication that the Fed’s monetary tightening is slowing economic growth. While the rate of inflation has slowed considerably, from a peak of 9.1% for the 12-month period ending in June 2022 to 4.9% for the 12 months ending in April 2023, it’s still well above the Fed’s targeted 2% rate. The question now is whether the Fed can succeed in its inflation-fighting strategy without pushing the economy into a recession.

Haworth is watching how corporations react to the inverted yield curve. Most companies managed to maintain a strong financial position through 2022, but Haworth says corporate revenue and earnings will be under increasing pressure. “There is less of a payoff from capital spending in the current interest rate environment,” says Haworth. “This could ultimately be one factor driving the economy toward a recession.” Consumer spending is the other important factor affecting the economic outlook. Haworth notes that consumer spending remains solid and given the strength of the labor market, may continue to support positive economic growth.

Check-in with your wealth planning professional to make sure you’re comfortable with your current investments and that your portfolio remains consistent with your goals, feelings toward risk and time horizon.

Related articles

How are rising interest rates impacting bond prices in 2022?

With the Federal Reserve increasing interest rates in an effort to get inflation under control, what opportunities does this create for bond investors?

How to put cash you’re keeping on the sidelines back to work in the market

Don’t let market volatility and an uncertain economic outlook derail your disciplined investing strategy.

Disclosures

Start of disclosure content
  1. U.S. Department of the Treasury, Daily Treasury Par Yield Curve Rates.

  2. Source: U.S. Bureau of Labor Statistics.

  3. Source: U.S. Bureau of Economic Analysis.

Start of disclosure content

Investment and insurance products and services including annuities are:
Not a deposit ● Not FDIC insured ● May lose value ● Not bank guaranteed ● Not insured by any federal government agency.

U.S. Wealth Management – U.S. Bank | U.S. Bancorp Investments is the marketing logo for U.S. Bank and its affiliate U.S. Bancorp Investments.

Start of disclosure content

U.S. Bank, U.S. Bancorp Investments and their representatives do not provide tax or legal advice. Each individual's tax and financial situation is unique. You should consult your tax and/or legal advisor for advice and information concerning your particular situation.

The information provided represents the opinion of U.S. Bank and U.S. Bancorp Investments and is not intended to be a forecast of future events or guarantee of future results. It is not intended to provide specific investment advice and should not be construed as an offering of securities or recommendation to invest. Not for use as a primary basis of investment decisions. Not to be construed to meet the needs of any particular investor. Not a representation or solicitation or an offer to sell/buy any security. Investors should consult with their investment professional for advice concerning their particular situation.

Start of disclosure content

For U.S. Bank:

Equal Housing Lender. Deposit products are offered by U.S. Bank National Association. Member FDIC. Mortgage, Home Equity and Credit products are offered by U.S. Bank National Association. Loan approval is subject to credit approval and program guidelines. Not all loan programs are available in all states for all loan amounts. Interest rates and program terms are subject to change without notice.

U.S. Bank is not responsible for and does not guarantee the products, services or performance of U.S. Bancorp Investments, Inc.

U.S. Bank does not offer insurance products. Insurance products are available through our affiliate U.S. Bancorp Investments.

Start of disclosure content

For U.S. Bancorp Investments:

Investment and insurance products and services including annuities are available through U.S. Bancorp Investments, the marketing name for U.S. Bancorp Investments, Inc., member FINRA and SIPC, an investment adviser and a brokerage subsidiary of U.S. Bancorp and affiliate of U.S. Bank.

U.S. Bancorp Investments is registered with the Securities and Exchange Commission as both a broker-dealer and an investment adviser. To understand how brokerage and investment advisory services and fees differ, the Client Relationship Summary and Regulation Best Interest Disclosure are available for you to review.

Insurance products are available through various affiliated non-bank insurance agencies, which are U.S. Bancorp subsidiaries. Products may not be available in all states. CA Insurance License #0E24641.

Pursuant to the Securities Exchange Act of 1934, U.S. Bancorp Investments must provide clients with certain financial information. The U.S. Bancorp Investments Statement of Financial Condition is available for you to review, print and download.

The Financial Industry Regulatory Authority (FINRA) Rule 2267 provides for BrokerCheck to allow investors to learn about the professional background, business practices, and conduct of FINRA member firms or their brokers. To request such information, contact FINRA toll-free at 1-800‐289‐9999 or via https://brokercheck.finra.org. An investor brochure describing BrokerCheck is also available through FINRA.

U.S. Bancorp Investments Order Processing Information.

Municipal Securities Education and Protection– U.S. Bancorp Investments is registered with the U.S. Securities and Exchange Commission and the Municipal Securities Rulemaking Board (MSRB). An investor brochure that describes the protections that may be provided to you by the MSRB rules and how to file a complaint with an appropriate regulatory authority is available to you on the MSRB website at www.msrb.org.